Carbon Tracking Digital Twins
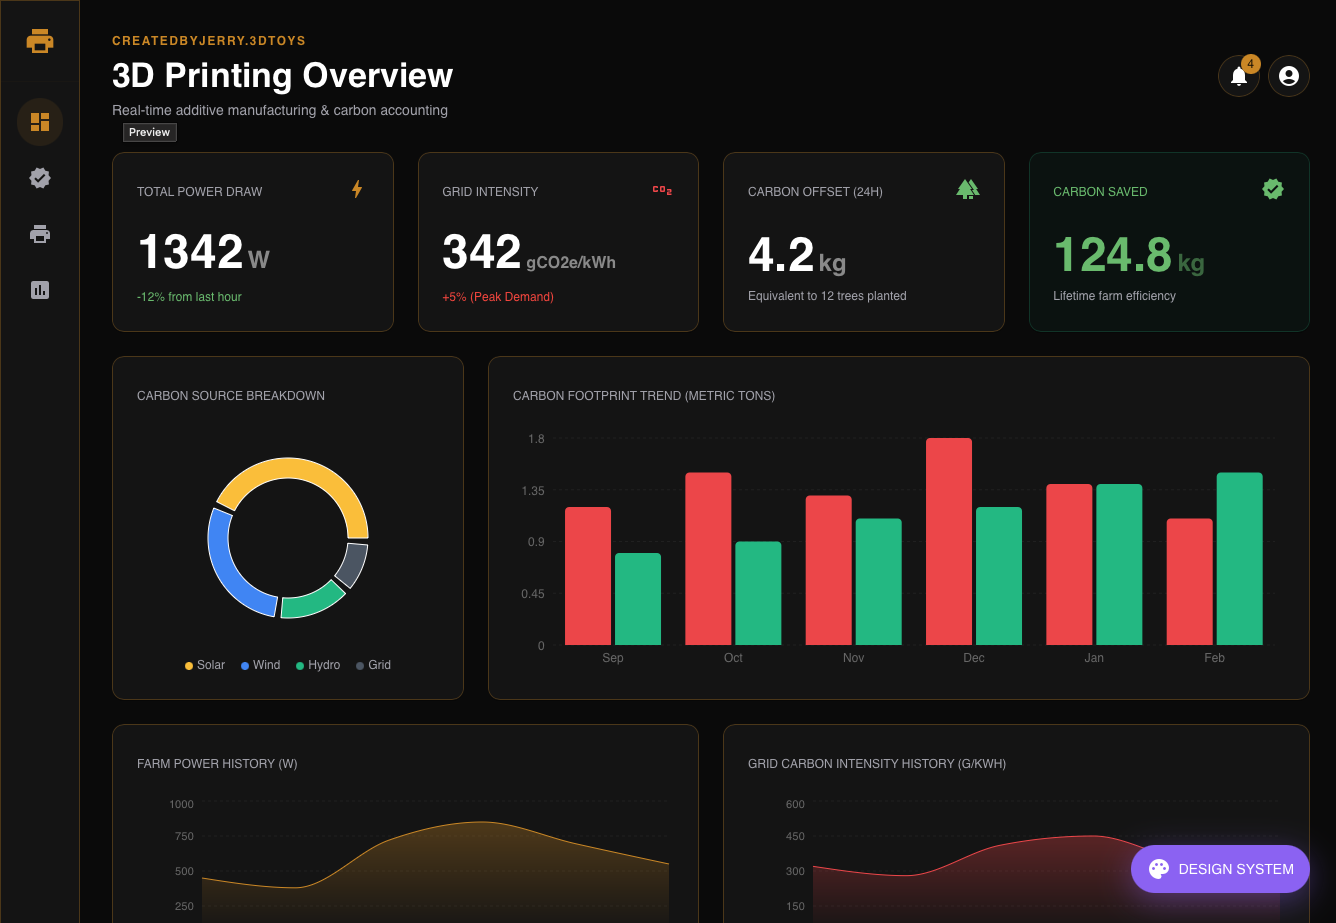
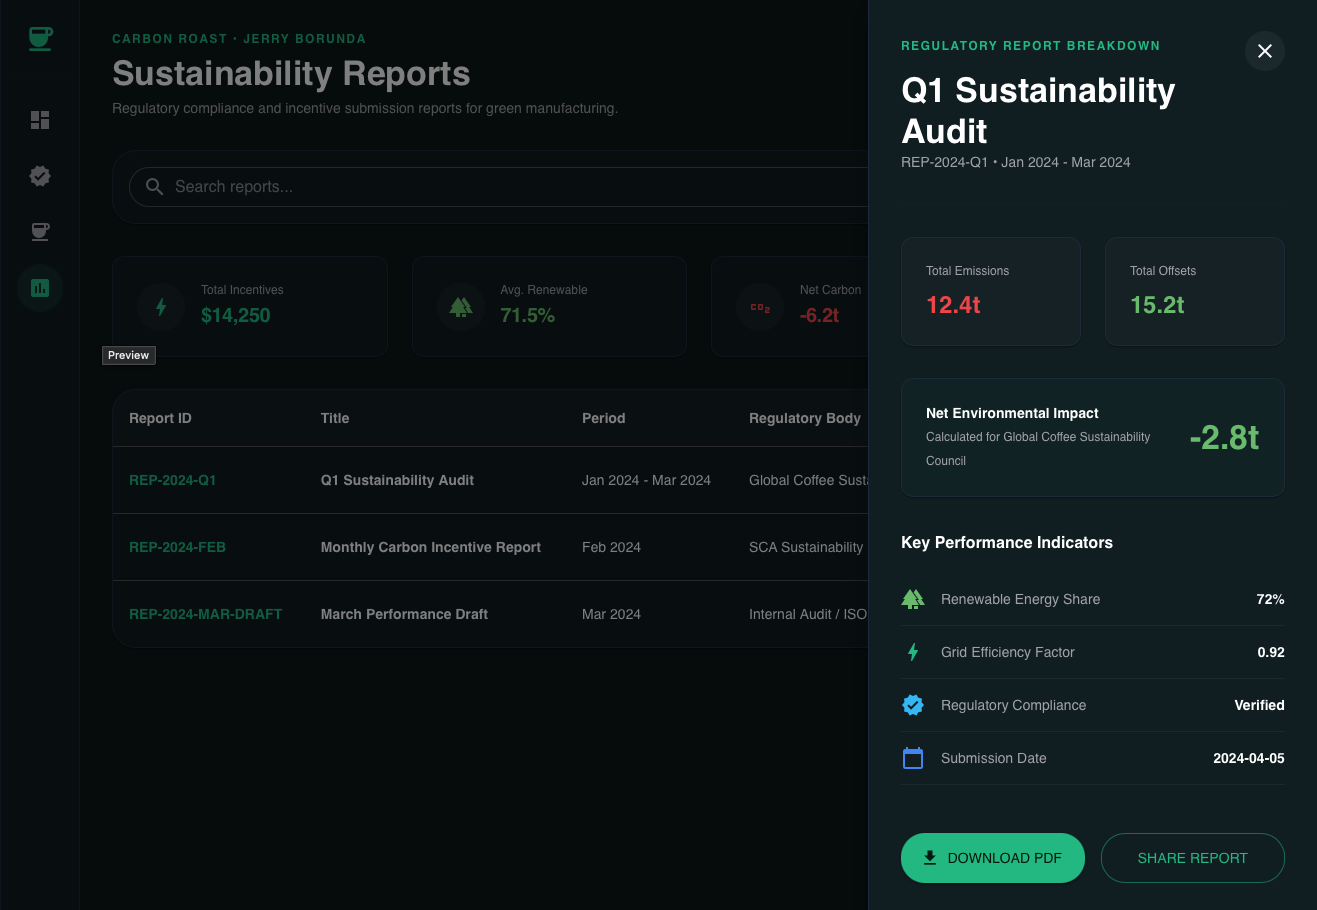
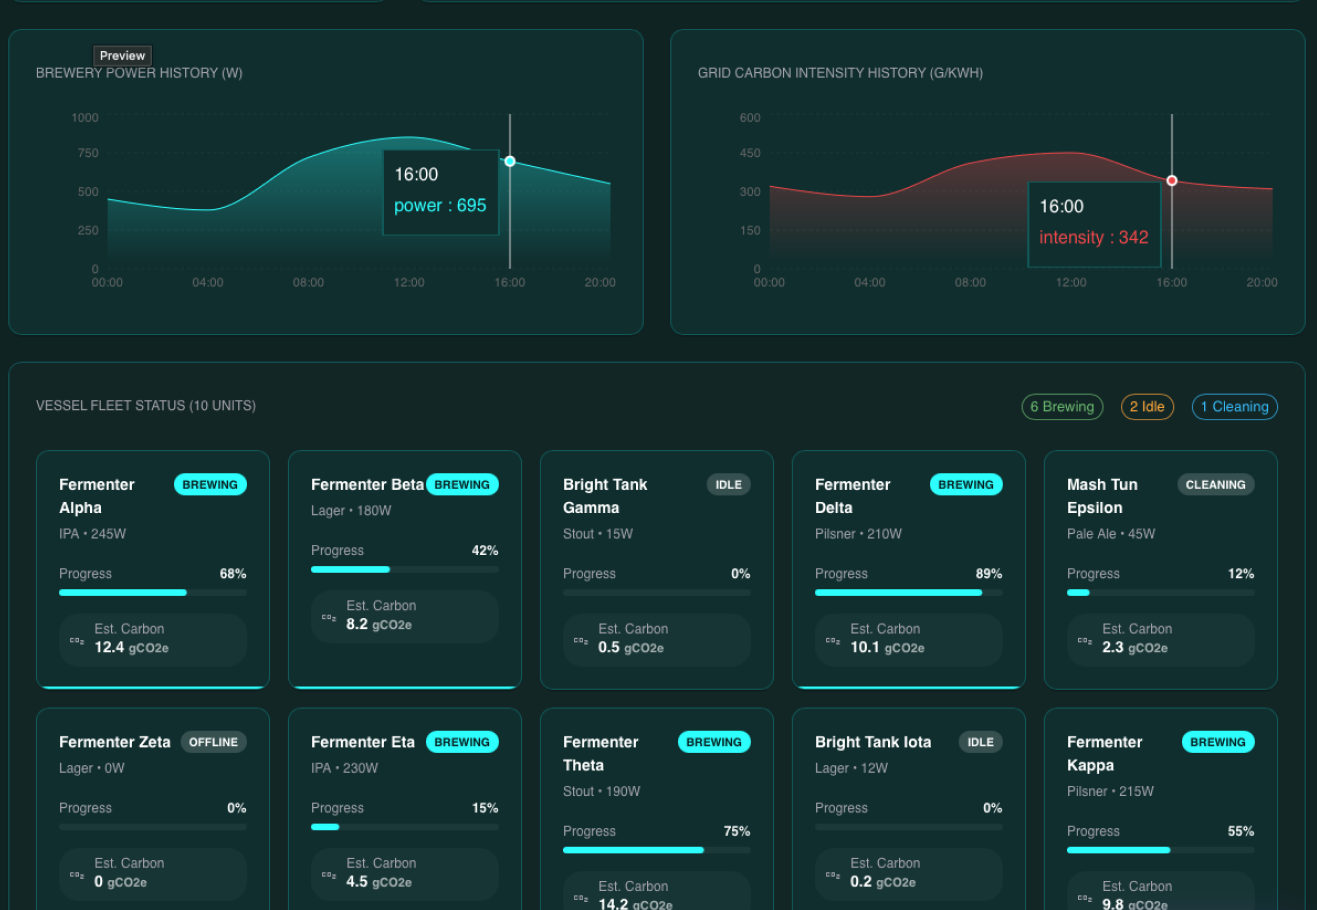
A series of three high-fidelity prototypes designed to visualize and monitor the environmental impact of localized production environments. By creating 1:1 digital mirrors of a 3D Printing Farm, a Coffee Roastery, and a Local Brewery, the project demonstrates how 3D telemetry can turn abstract carbon data into a tangible, navigable spatial experience.
Problem
Core issues and why it matters
Business Problem:
Small-to-medium industrial operations face unique "blind spots" in sustainability:
- 3D Print Farms: Experience high material waste and erratic energy draws across dozens of unsynced machines.
- Coffee Roasting: High thermal exhaust and energy-intensive roasting cycles are difficult to quantify per-batch.
- Local Breweries: Energy-heavy refrigeration and fermentation cooling often lead to "invisible" leaks in the supply chain.
- Collectively, these businesses lack a unified way to report ESG (Environmental, Social, and Governance) metrics without enterprise-level overhead.
User Problem:
Operators struggle to interpret 2D spreadsheets and flat dashboards to identify which specific physical asset (a leaking fermentation tank or an overheating 3D printer) is driving carbon inefficiency.
Technical Problem:
Aggregating disparate IoT sensor data into a performant, real-time 3D environment that maintains accuracy without sacrificing visual clarity.
Why this matters:
To achieve true carbon neutrality, carbon tracking must move from an after-the-fact reporting exercise to a real-time operational tool.
Challenge
Constraints and complexity shaping the solution
The core complexity lay in Industrial Data Density. I had to design a system that could visualize invisible metrics—such as thermal exhaust, electrical load, and carbon intensity—directly atop the 3D geometry of the machines. The interface needed to remain minimalist and technical, avoiding visual noise while providing deep-dive telemetry for specific hardware nodes.